Last week, the SEC released its latest report on equity crowdfunding under Regulation Crowdfunding activity (see release). But its Regulation Crowdfunding numbers rely on Form C-U filings — and issuer compliance with those forms has historically been low.
The result? Incomplete and inconsistent data about one of the fastest-growing corners of private capital markets.
At CCLEAR, we’ve built the industry’s first comprehensive, transaction-level dataset for equity crowdfunding under Regulation Crowdfunding (RegCF) – covering both equity and debt offerings. We track every campaign, every platform, and every investment — day by day — across the full lifecycle of each offering.
It’s not estimated. It’s not sampled. And it doesn’t rely on issuers to follow up after the fact.
What follows are five charts that show the depth, precision, and insight this dataset delivers — insight the SEC and other data providers simply can’t replicate.
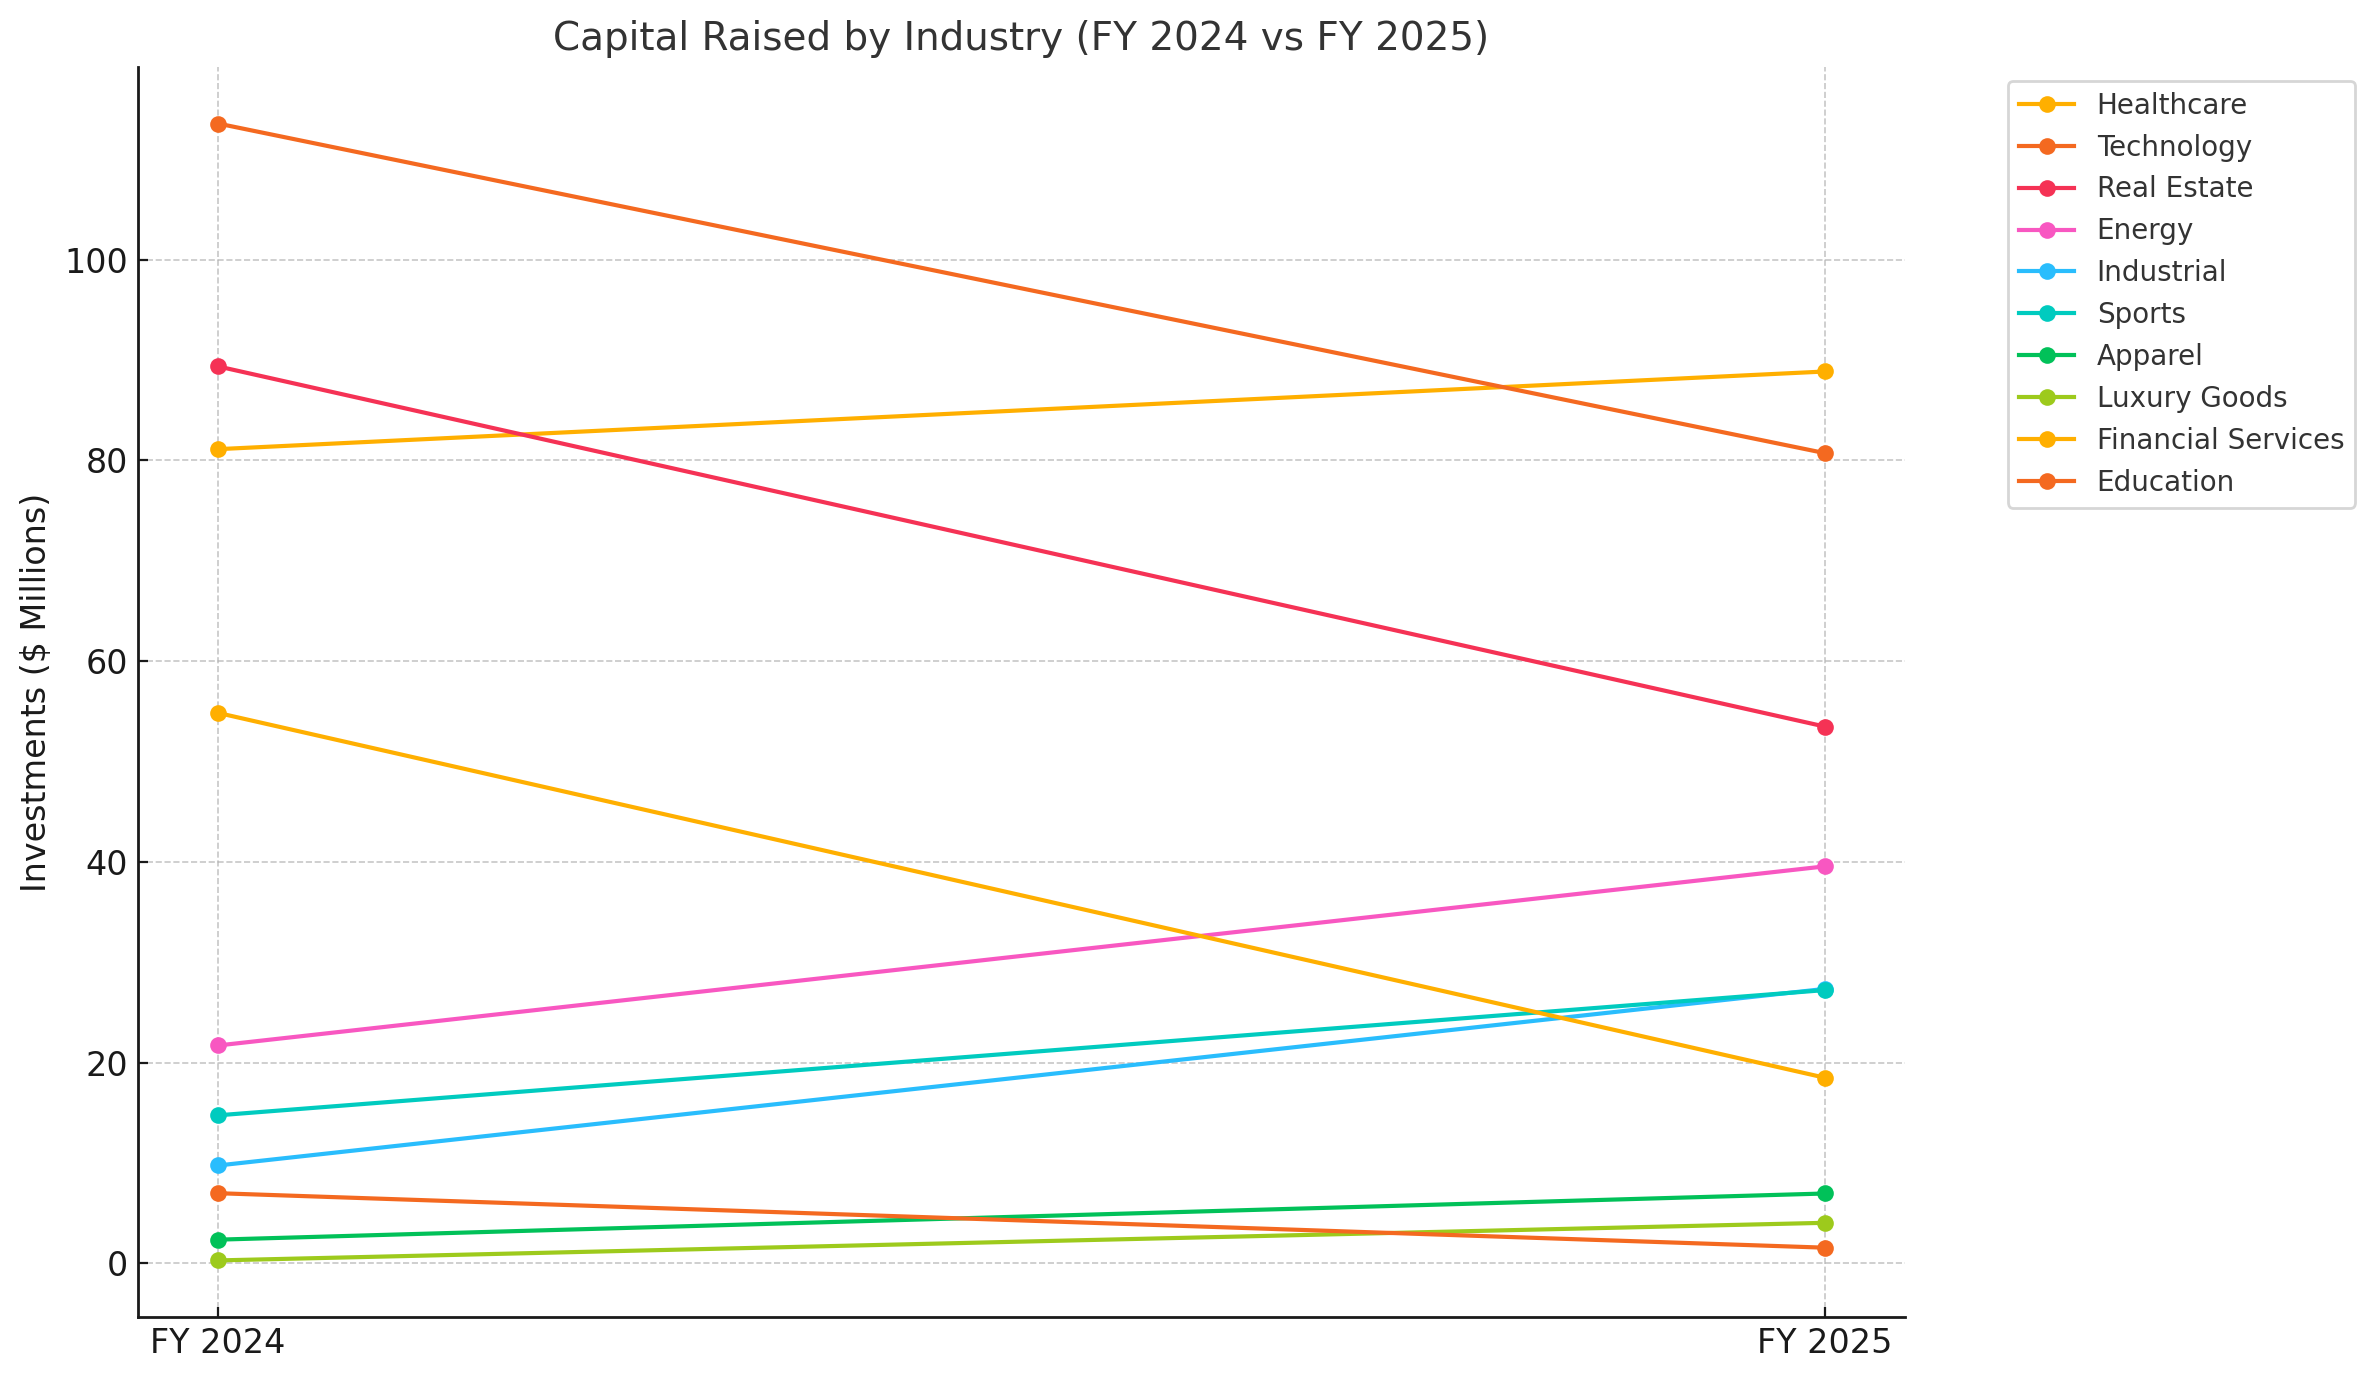
🏭 Capital Raised by Industry: FY 2024 vs. FY 2025
This chart compares capital allocation by industry across the trailing 12 months — from June to May, year-over-year. In other words:
- FY 2024 = June 2023 – May 2024
- FY 2025 = June 2024 – May 2025 (the most recent 12 months)
Unlike the SEC’s Regulation Crowdfunding report, which relies on delayed and incomplete Form C-U filings, our data is live. We track investment activity daily, across every open campaign, platform, and security type — with no need to wait months for quarterly updates or year-late federal reporting.
🔍 What It Shows:
- Healthcare, Energy, and Industrial & Manufacturing sectors saw significant growth in FY 2025, suggesting a shift toward real-world solutions and harder tech.
- Technology, Financial Services, and Real Estate experienced notable declines — likely driven by macro trends and valuation resets.
- Emerging consumer sectors — like Luxury Goods, Apparel, and Sports — posted modest gains, signaling niche investor interest.
This kind of time-sensitive, sector-level analysis is only possible with complete, real-time investment tracking — not static form-based filings.
Equity Crowdfunding Capital Raised by Industry: FY 2024 vs. FY 2025
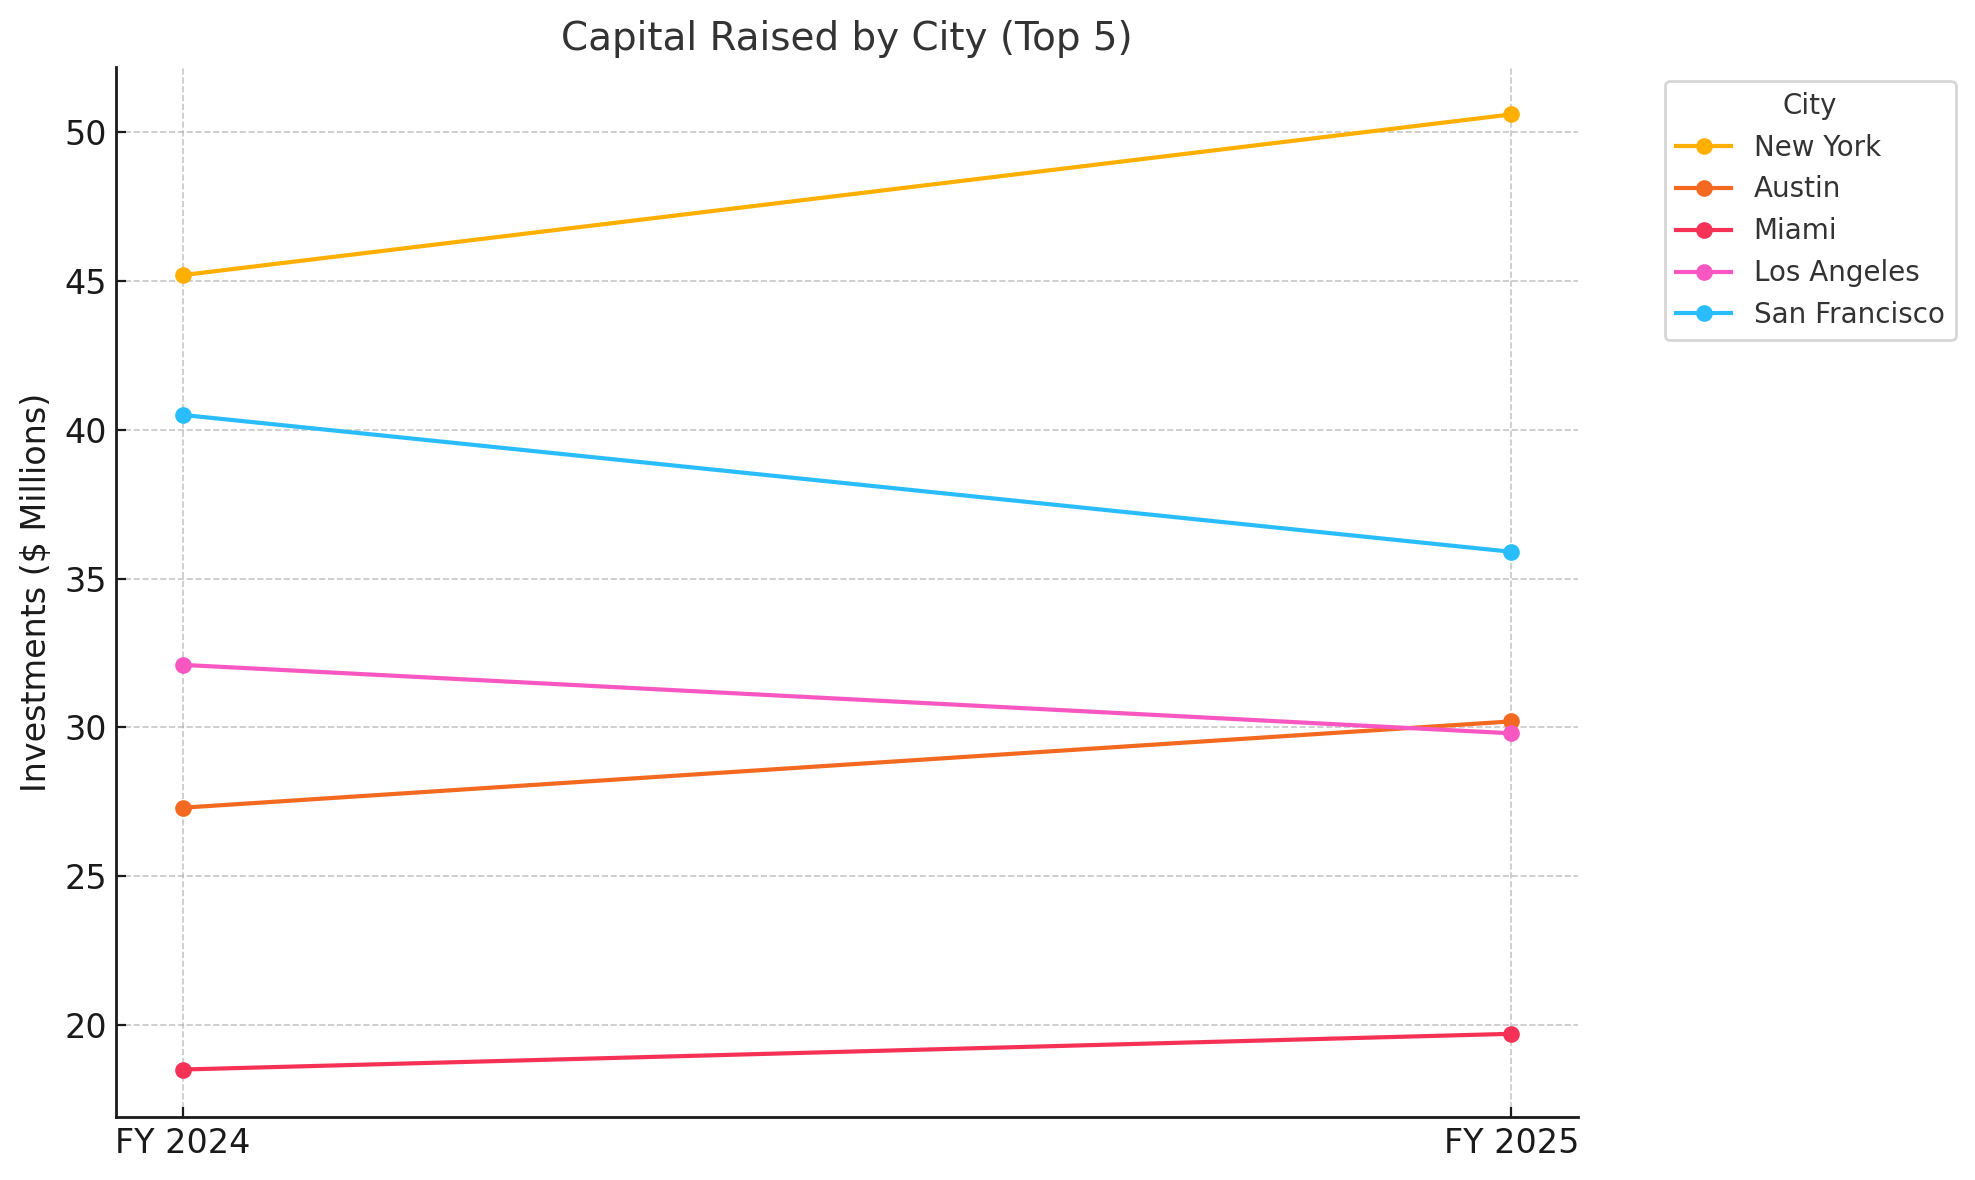
🌆 Where Regulation Crowdfunding Capital Is Really Flowing: City-Level Crowdfunding Trends
The SEC reports capital by state. That’s a start — but it misses the dynamics driving this market. This chart shows where equity crowdfunding capital actually landed, broken out by city (not just state). Because CCLEAR tracks every transaction daily and geolocates each issuer by zip code, we can show investment flows at the metro level — not just aggregated rollups.
🔍 What It Shows:
- Over this past year, Austin, Miami, and New York City led all cities in capital raised — with each growing year-over-year, even as overall market volume softened.
- Los Angeles and San Francisco, by contrast, saw year-over-year declines, reflecting shifting founder activity and possible investor fatigue in legacy tech hubs.
This level of detail is essential for:
- Economic development teams aiming to support local startup ecosystems
- Data platforms looking to map innovation geography in real time
- Policy analysts interested in regional trends in retail capital access
You won’t find this in the SEC’s annual releases — and you won’t have to wait for incomplete filings.
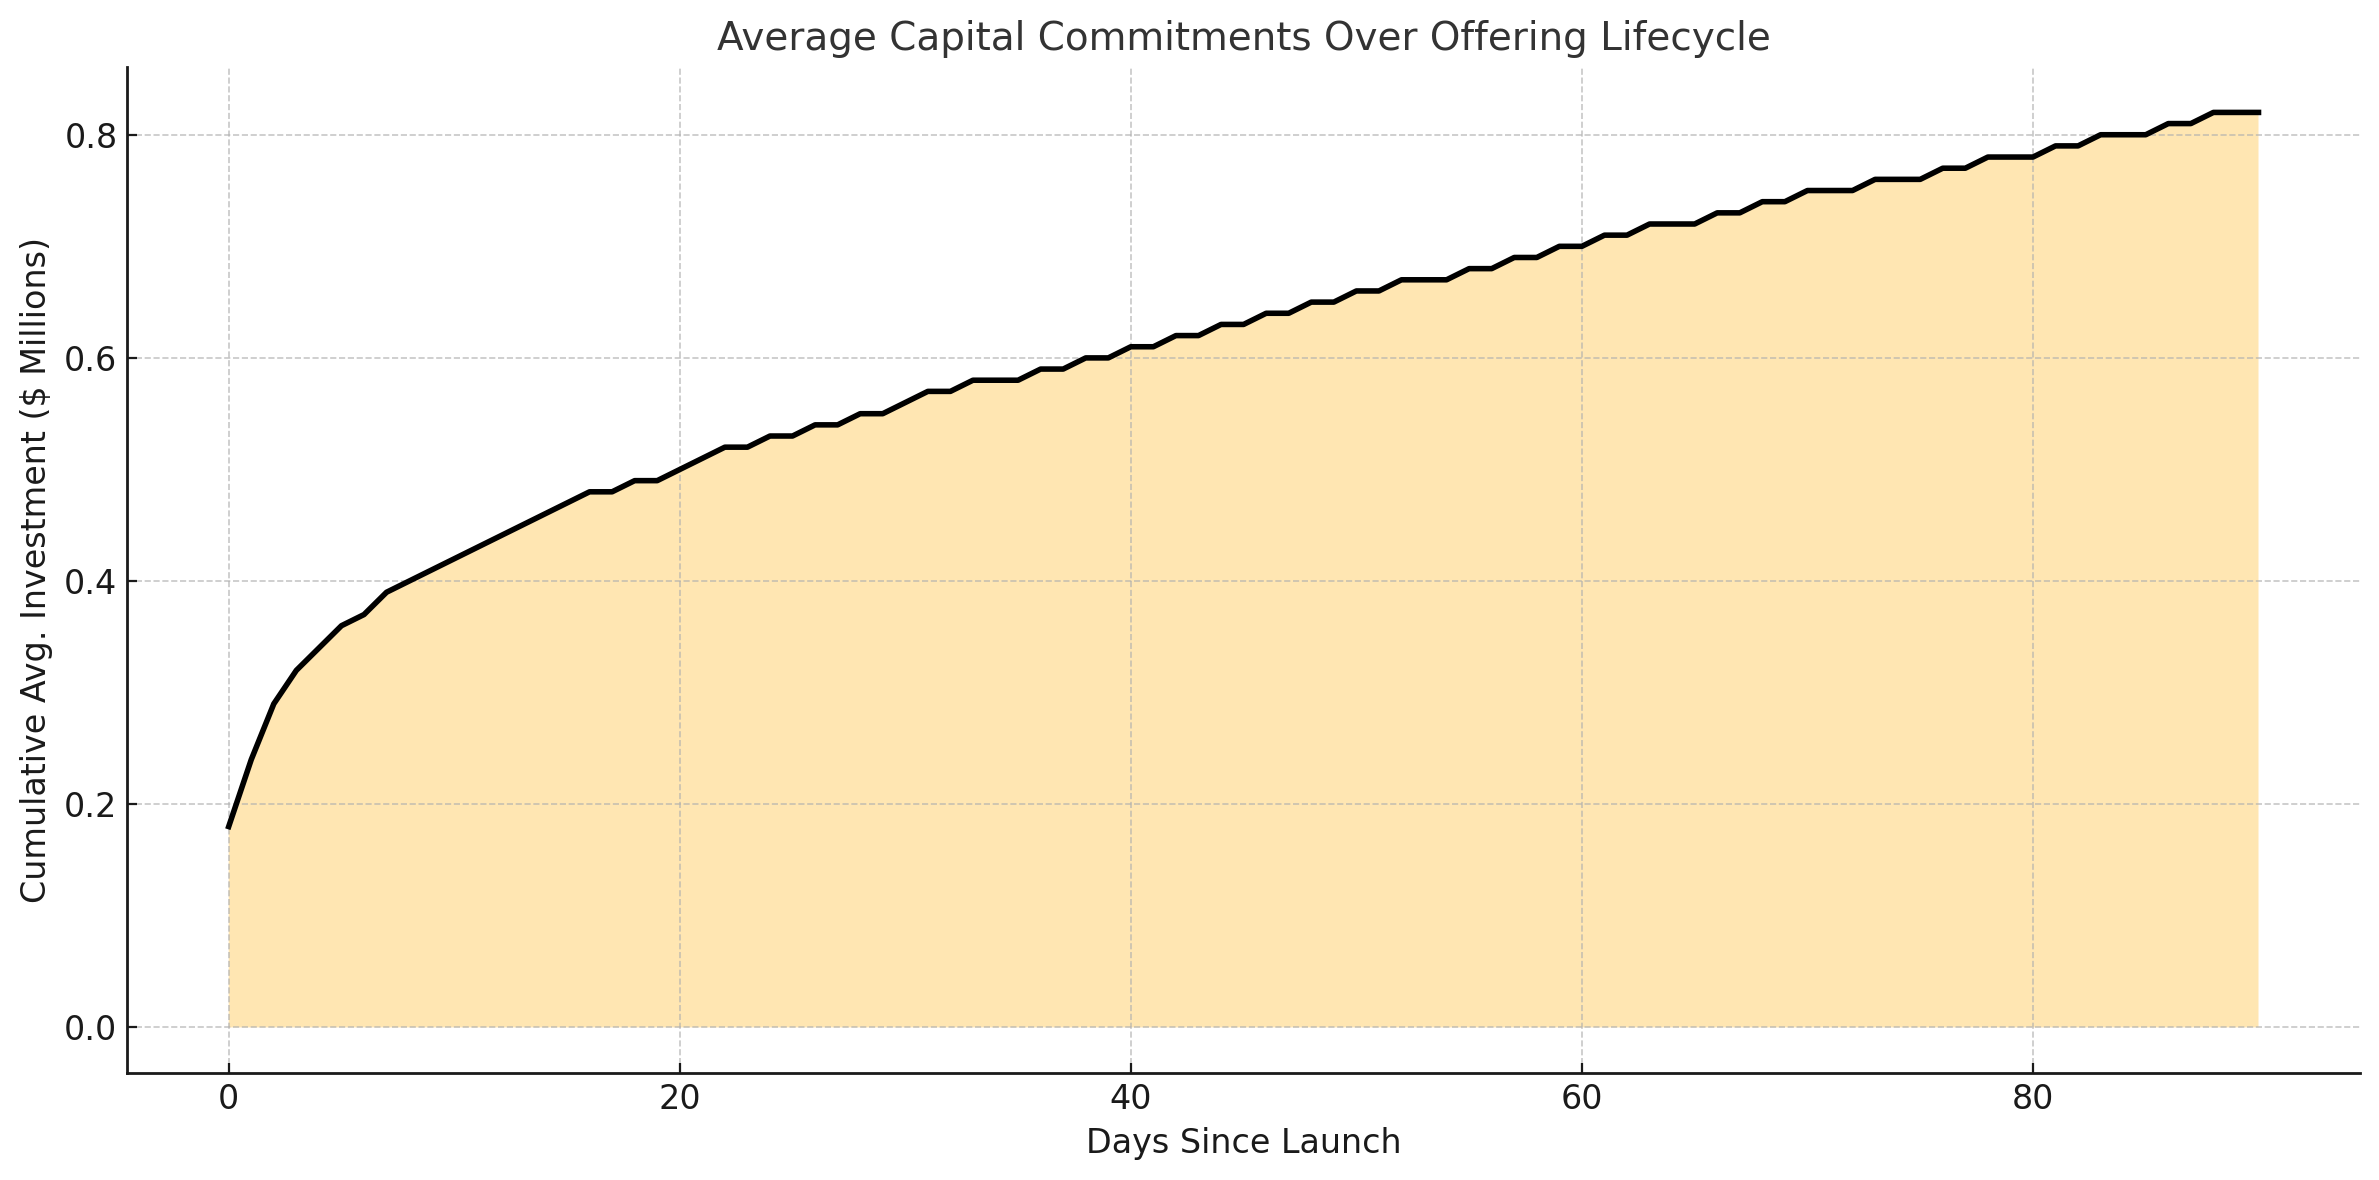
📈 How Campaigns Actually Raise Capital: Daily Velocity Over Time
Most reports, including the SEC’s, focus on how much an offering raised in total — but not how it was raised.
This chart shows the average cumulative investment per offering, day by day, across a 90-day Reg CF campaign lifecycle. It’s powered by CCLEAR’s daily tracking of every transaction, across every open campaign.
🔍 What It Shows:
- Most campaigns follow a predictable shape: a strong open, a mid-campaign plateau, and a final-days push — often driven by deadline urgency.
- By Day 10, the average offering has raised nearly half its eventual total.
- The final 30 days deliver steady incremental growth, but rarely explosive gains — highlighting the importance of early marketing.
This kind of lifecycle-level insight is only possible with continuous, high-frequency data collection. With CCLEAR, you can model campaign velocity, predict outcomes, and time promotional activity — none of which is visible in the SEC’s static filings
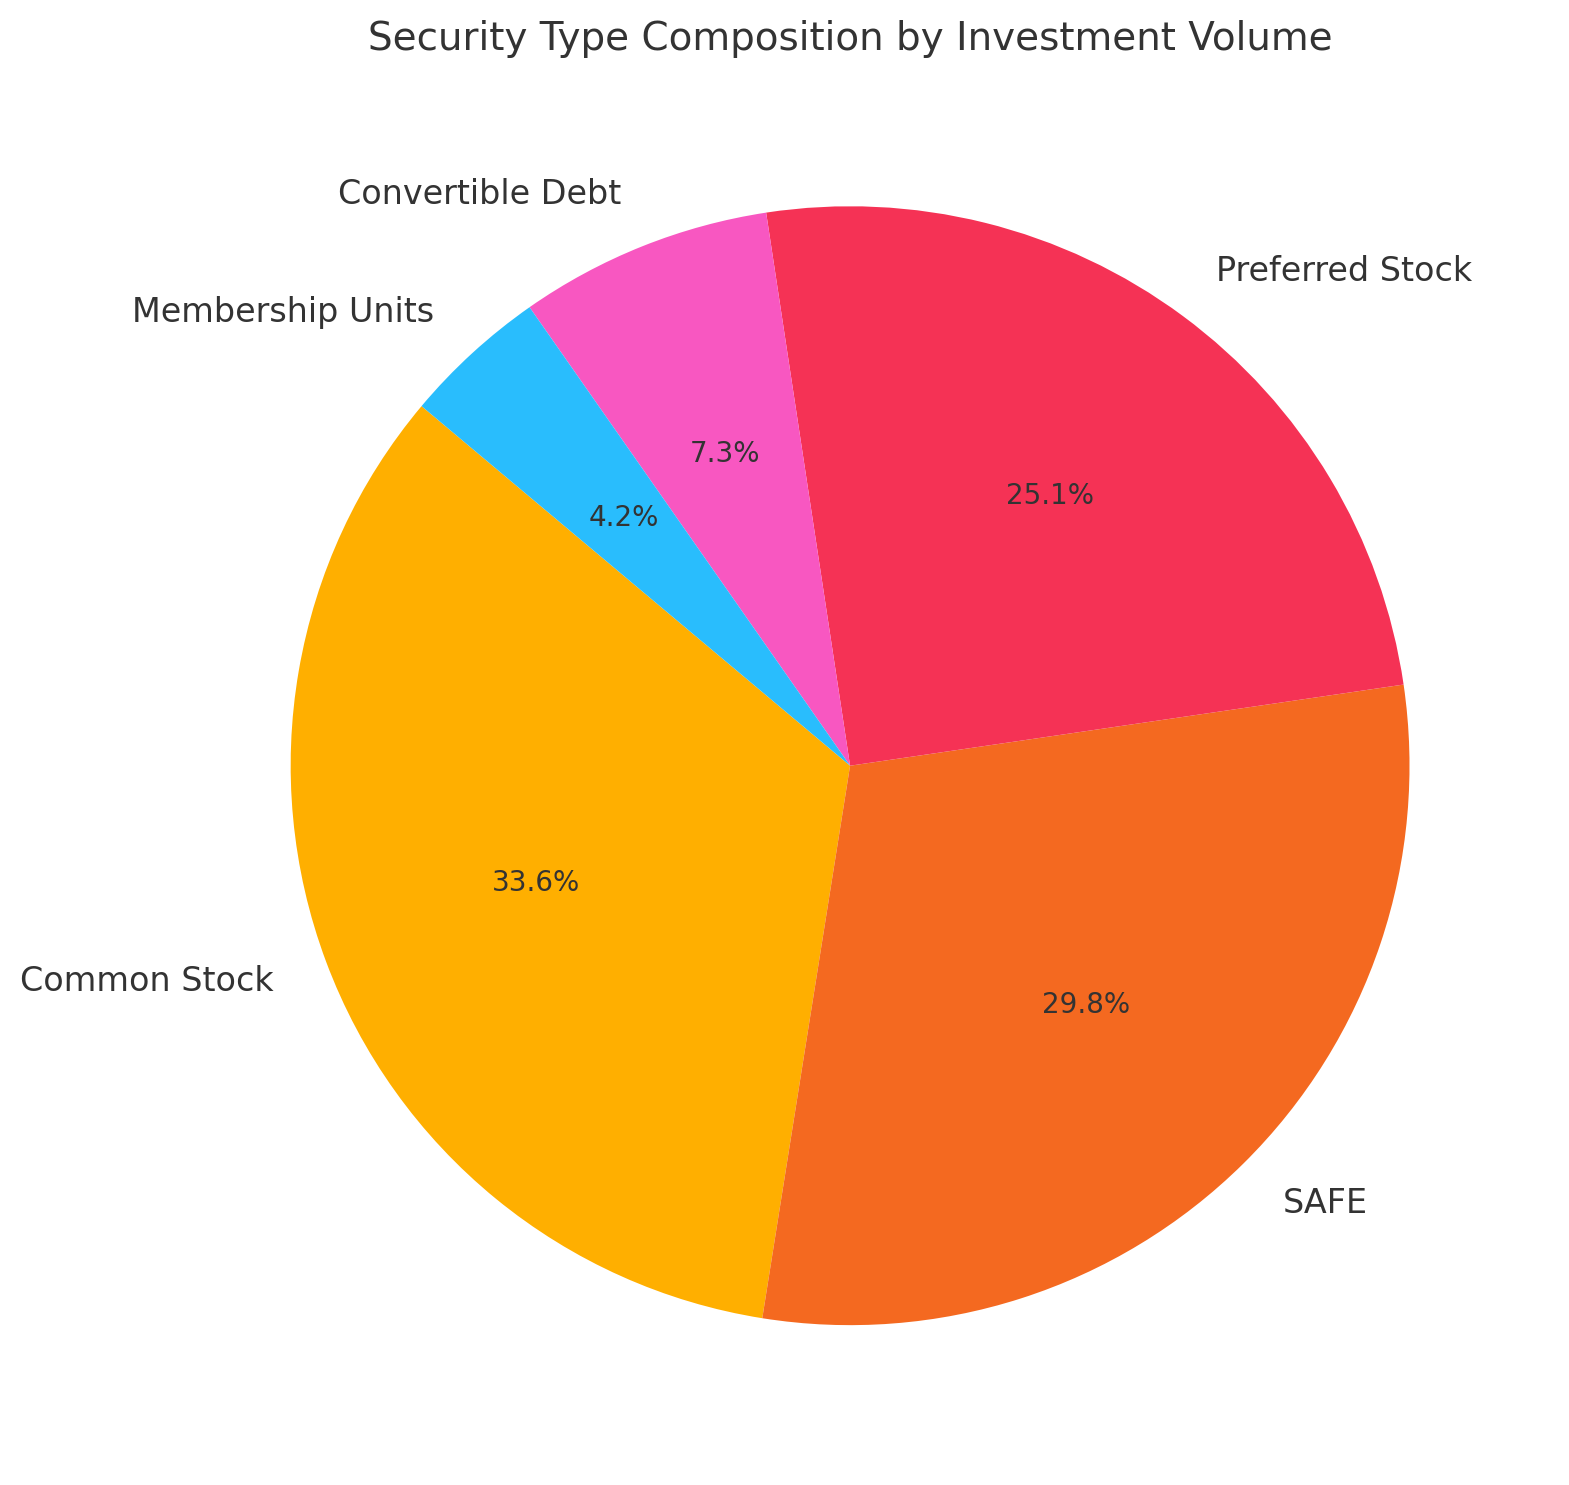
🧾 What Investors Are Actually Buying: Security Type Breakdown
The SEC’s equity crowdfunding reports the existence of securities — but not how much capital is actually flowing into each one. This chart shows the total investment volume raised by each major security type across all Reg CF offerings in our dataset.
Unlike static filings or post-close summaries, CCLEAR captures every transaction by instrument as it happens — whether it’s equity, debt, revenue share, or hybrid instruments.
🔍 What It Shows:
- Common Stock and SAFEs (Simple Agreements for Future Equity) dominate the market — together accounting for a majority of all Reg CF capital raised.
- Preferred Stock is also widely used, particularly for larger, later-stage raises.
- Convertible instruments, membership units, and revenue shares make up a smaller but important part of the capital stack — reflecting campaign structure experimentation across sectors.
This data is critical for:
- Legaltech and compliance platforms analyzing securities trends
- Market analysts studying private market standardization
- Investment platforms optimizing campaign structuring for investor appeal
No guesswork, no lag — just a clean, real-time view into how the capital is structured.
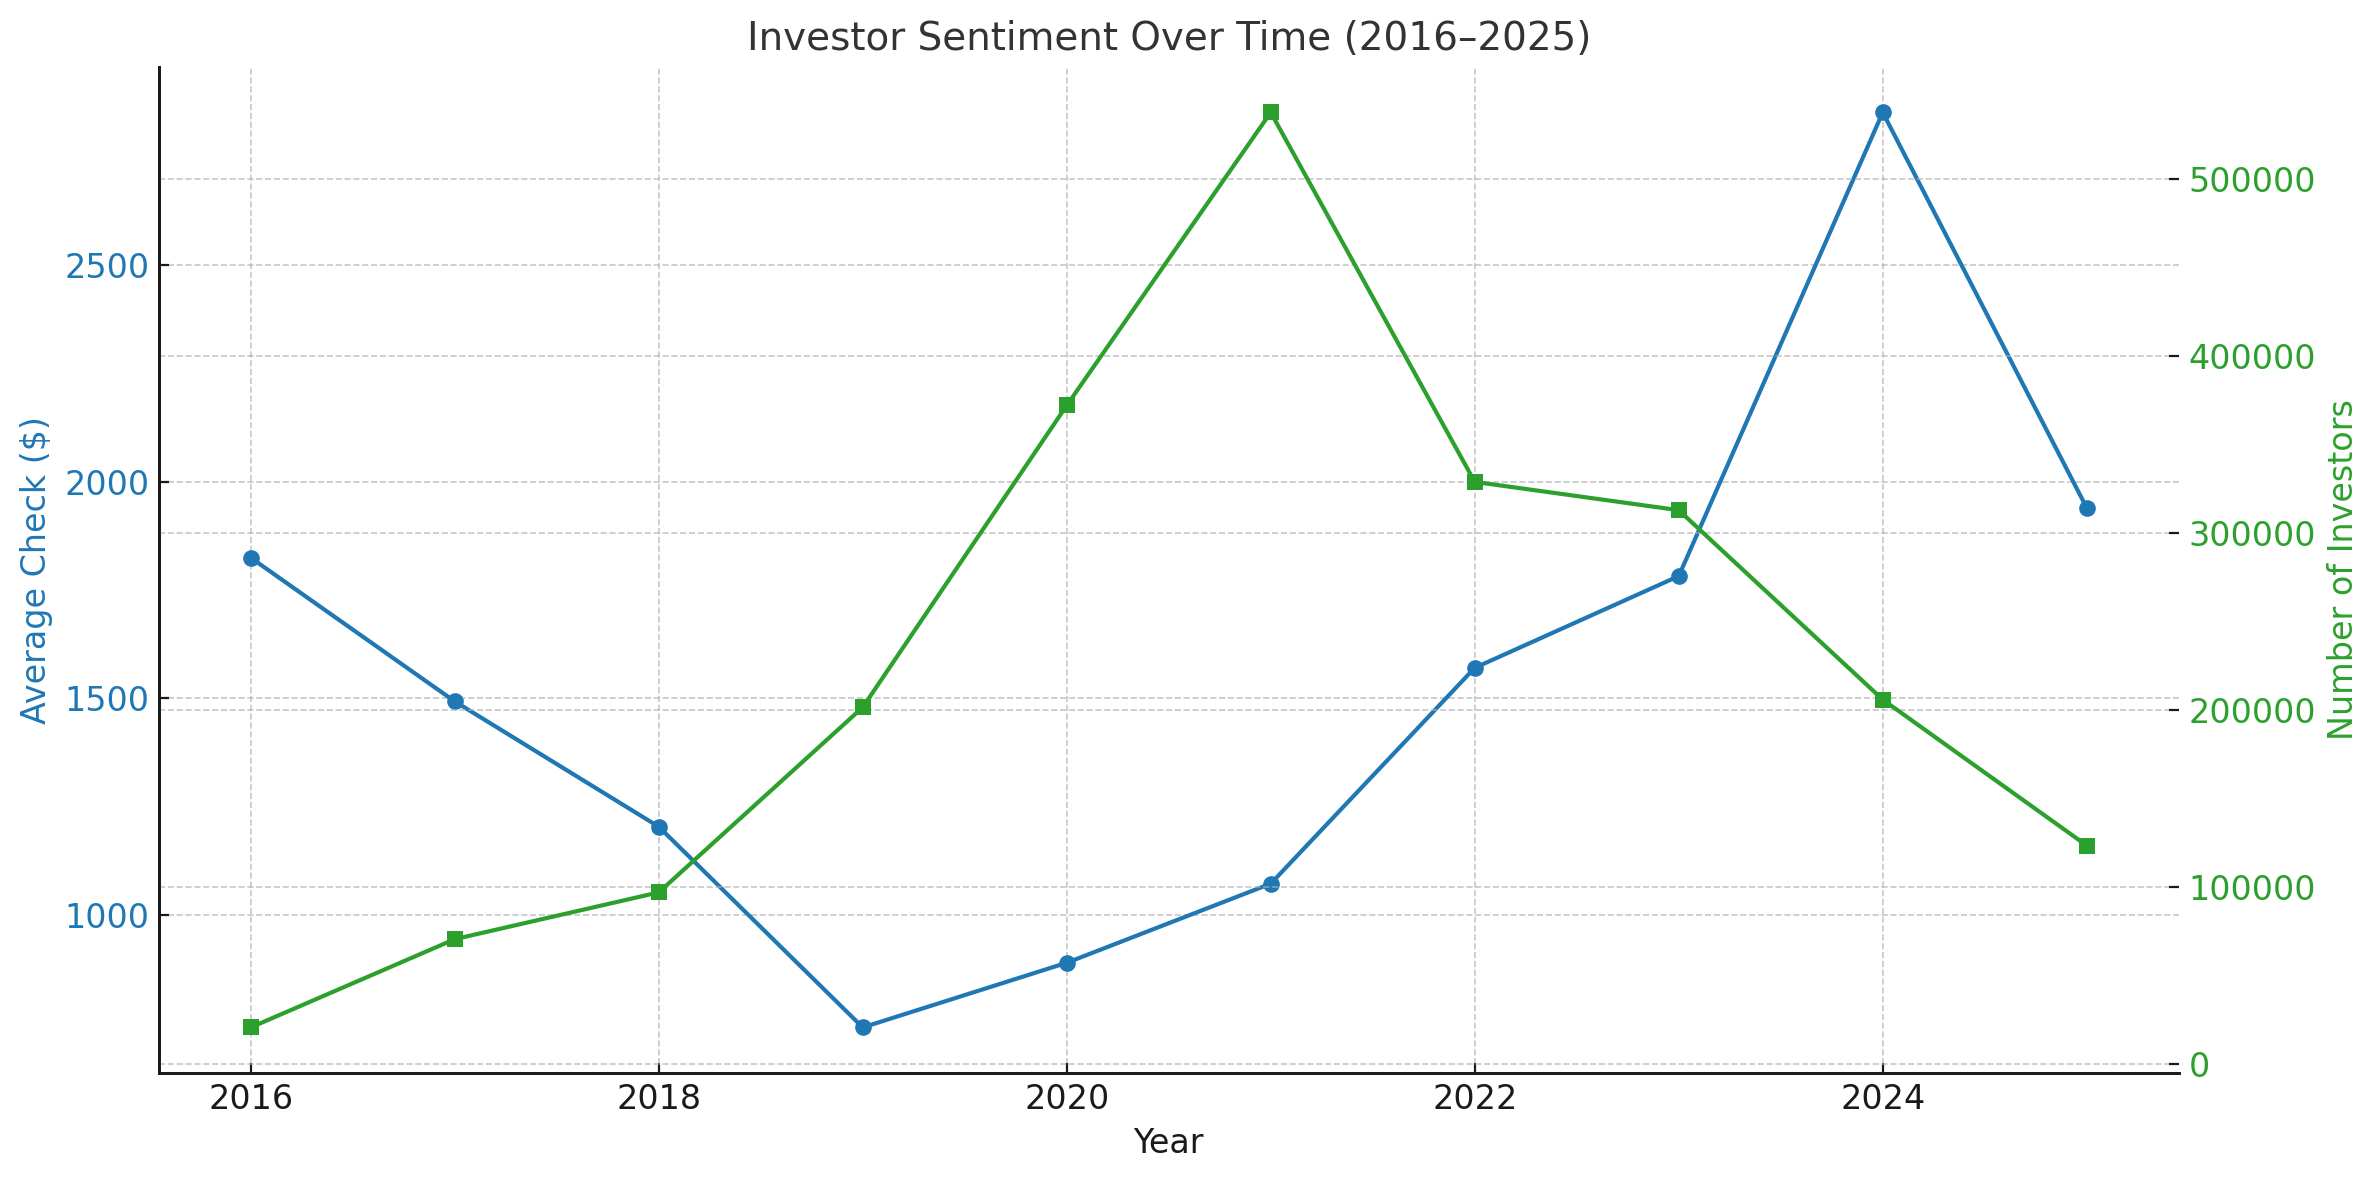
💬 Retail Crowdfunding Investors Are Pulling Back — But Writing Bigger Checks
This chart shows investor sentiment for Reg CF offerings, across fiscal years (June–May), with parallel 506(c) amounts removed for a clean look at true retail crowdfunding activity.
🔍 What It Shows:
- The number of investors peaked in FY 2021 at over 515,000, then declined consistently through FY 2025 (down to ~233,000).
- Meanwhile, the average check size has grown since FY 2020’s low, climbing from $689 to over $1,700 in FY 2024, and holding steady in FY 2025.
🧠 What It Means:
This pattern aligns with macro and venture market trends:
- Venture capital slowed dramatically post-2021, rippling into Reg CF as fewer campaigns launched and investors grew cautious.
- Inflation, supply chain uncertainty, and rate hikes suppressed casual retail participation.
- But those who remain are writing larger, more confident checks — signaling a shift toward experienced or higher-conviction backers.
This isn’t speculation or modeling — it’s based on every investment transaction, traced back to each open campaign.
📬 Build Smarter With a Complete Equity Crowdfunding Dataset
The Reg CF market is no longer a rounding error in private capital — it’s a multi-billion-dollar pipeline of early-stage innovation, investor behavior, and retail capital formation.
With CCLEAR, you don’t have to rely on partial filings, backward-looking reports, or incomplete disclosures.
We offer:
- Full coverage of every Reg CF campaign, platform, and security
- Daily transaction tracking, not just closing summaries
- Investor-level trends, campaign pacing, and capital velocity
If your team works in market intelligence, private capital research, investment strategy, or economic analysis, this is the data infrastructure you’ve been waiting for.
Let’s connect — we’d love to show you what’s possible.